Figure 4: Share of Humanities Bachelor’s Degrees Awarded to Historically Minoritized Students, by Institution Type, 1997 to 2022
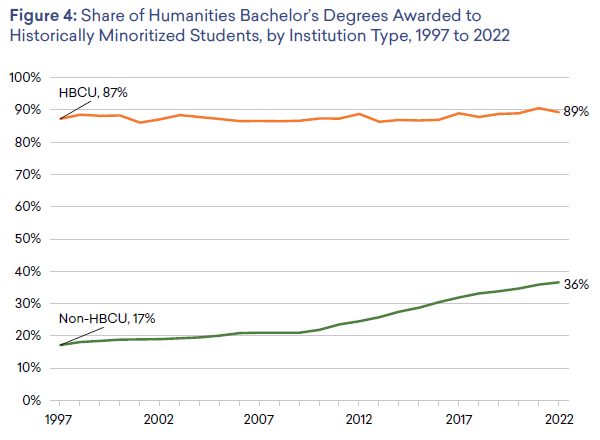
This decline is due primarily to recent growth in the share of humanities degrees awarded to traditionally minoritized students at non-HBCU institutions (see figure 4). From 1997 to 2022, the share of bachelor’s degrees awarded by HBCUs that went to such students increased slightly, from 87% to 89%. In comparison, the share of humanities degrees awarded to historically minoritized students at non-HBCU institutions grew modestly from 1997 to 2009 (increasing from 17% to 21%), but then increased more rapidly over the next 12 years (to 36% of all humanities degrees conferred).
While most of the students receiving humanities degrees at HBCUs are Black/African American, a growing number are members of other minoritized racial or ethnic groups. In 2022, humanities degree completers at HBCUs included 153 students from those populations, up from fewer than 50 prior to 2009 and accounting for 5% of the students receiving humanities bachelor’s degrees at HBCUs.