Figure 3: Humanities Degrees as a Share of All Bachelor’s Degrees Awarded, by Institution Type, 1997 to 2022
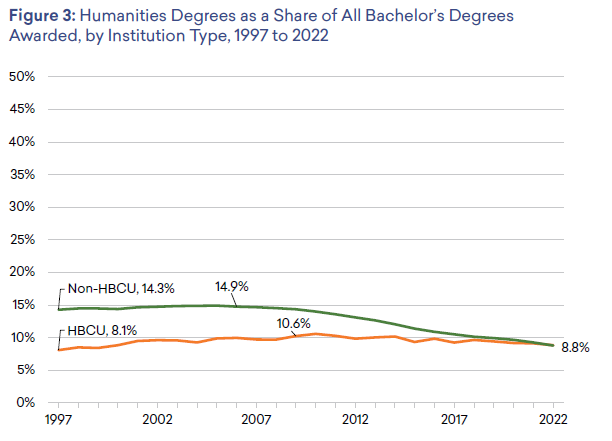
The effect of these trends is apparent when one looks at the field’s “market share” at HBCUs relative to other colleges and universities (see figure 3). The shares of bachelor’s degrees being awarded in the humanities has converged at both types of institutions. In 1997, the humanities accounted for just 8.1% of the bachelor’s degrees awarded at HBCUs but then increased to 10.6% of the degrees conferred in 2010. In comparison, at all other colleges and universities in 1997, the humanities accounted for 14.3% of the bachelor’s degrees awarded, with that share growing to 14.9% in 2005. But while the share of humanities bachelor’s degrees awarded at non-HBCUs shrank by more than a third after the mid-2000s, the decline that began at HBCUs five years later was more gradual. As a result, the two trends converged in 2022, with the humanities accounting for 8.8% of the bachelor’s degrees awarded at both types of institutions.
HBCUs have played a vital role in helping to diversify the mix of students earning humanities degrees. In 2022, HBCUs accounted for 13.5% of the humanities degrees awarded to students identifying as Black or African American and 3.8% of the humanities degrees awarded to students from all historically minoritized racial and ethnic groups.3 However, both shares have decreased since 1997, when 17.3% of the humanities bachelor’s degrees earned by Black/African American students and 6.8% of the degrees awarded to historically minoritized students were at HBCUs.