
By Robert B. Townsend, Director of the Academy’s Humanities, Arts, and Culture Programs and Codirector of the Humanities Indicators
A new study by the Academy’s Humanities Indicators (HI) staff reveals significant changes in students’ majors from the time they begin their baccalaureate studies to when they complete a degree (if they do). To arrive at these findings, the HI staff commissioned data from the National Student Clearinghouse, which provides the most comprehensive information available on students’ educational pathways through higher education. The data focused on the cohort of students who began their studies in fall 2017 and their status as of June 2024.
The results offer useful insights into the underlying patterns of movement after matriculation, most notably:
After seven years, around 30 percent of the students who started work toward a bachelor’s degree in every major field had ended their studies without a degree, and another 1 percent were still working toward a degree.
A significant number of students who completed a degree had switched to a different subject area from the one they initially started in.
Only two fields—the behavioral and social sciences and the humanities—gained more students than they lost to either attrition or students switching to other fields. All other subject areas experienced a net loss.
Most students who completed a second major earned it in the same field as their first major.
Prior to this research, most information about college majors came from annual degree completion data reported by colleges and universities to the U.S. Department of Education. These data provide invaluable information about the number of students completing degrees in particular fields and the students’ demographics. However, the data set offers no insights about how the fields compare in completion rates, how many students change majors in the course of their studies, or the relationships between double majors at completion. This new study aims to address some of those gaps, though it focuses on only one cohort of students.
Who Enters a COLLEGE Major?
According to the Clearinghouse, almost two million students started working toward a bachelor’s degree in fall 2017. Seven years later, 70 percent had completed a degree, with only modest variations between the fields of study (Figure 1).
Figure 1: Completion and Attrition Among Students Starting a Bachelor’s Degree Program in Fall 2017 (Status as of Summer 2024), by Primary Major Declared in 2017
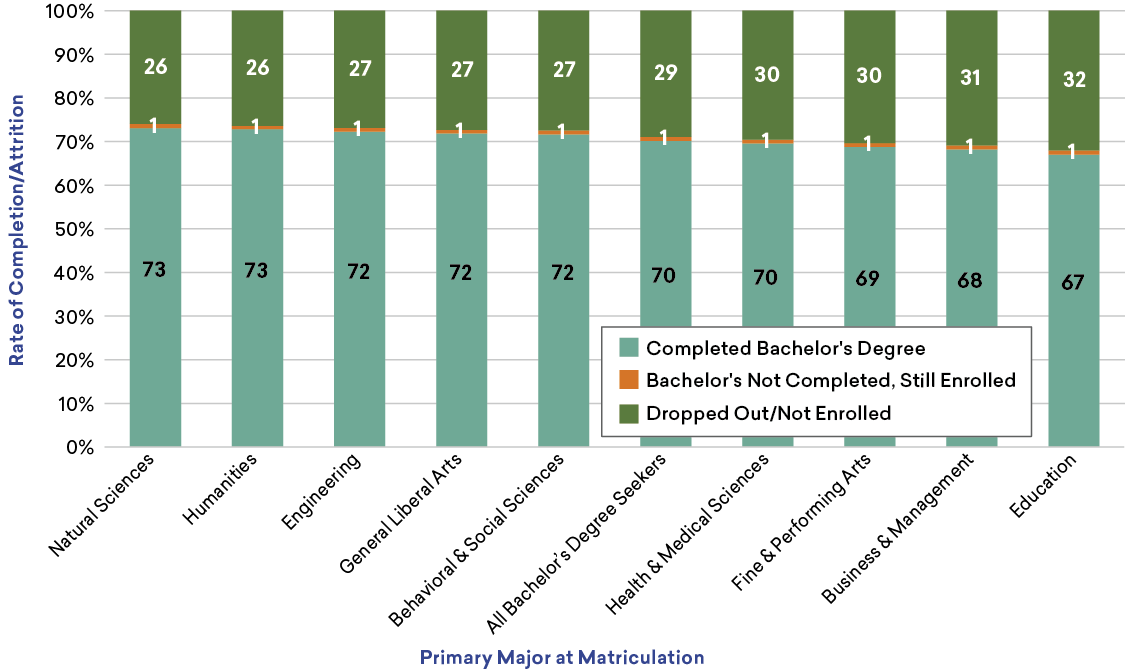
Source: Custom data runs from the National Student Clearinghouse for the Humanities Indicators.
Students who began with majors in the natural sciences and the humanities had the highest degree completion rates within the study’s seven-year window, with 73 percent finishing their degree by summer 2024. But that was only one percentage point higher than the completion rates for students who started in three other fields. And three fields had completion rates below 70 percent (the fine and performing arts, business and management, and education), with the lowest completion rates, just 66 percent, found among students in smaller—typically vocational—subjects that the HI aggregates into an “Other” category (not shown).
This study also examined the subpopulation of students who had completed an associate’s degree before matriculation into baccalaureate studies. These students accounted for 10 percent of the entering cohort. Unsurprisingly, given their head start in coursework toward the degree, these students were more likely to complete the degree within seven years of matriculation (with a completion rate of 77 percent).
Students with an associate’s degree were significantly more likely than the typical college student to start with a major in one of the academic fields. While 17 percent of the students matriculating in 2017 began their studies in the general liberal arts category, less than 6 percent of those entering baccalaureate studies with an associate’s degree chose that subject area. Compared to their peers without associates degrees, these students were more likely to start with a major in the health and medical sciences, business and management, or the behavioral and social sciences. This suggests the importance of the early years of study—when students are taking general education requirements—as a period of sorting and reassessment of initial majors. However, further research is needed as this study did not examine when students switched majors.
How Much Movement is There Between Majors?
One of the primary goals of this study was to determine how much migration between majors occurred from matriculation to completion. Figure 2 shows the movement between majors among students who had completed a degree. Of the nearly 1.4 million students from the fall 2017 matriculating cohort who completed a degree by the summer of 2024, 47 percent had changed their primary major somewhere along the way. For most fields, more than three-quarters of the students who started in a field and completed a degree remained in the same field from beginning to end.
Business and management majors and engineering majors were the most likely to stick with their majors (at 83 percent and 80 percent, respectively). Students were least likely to remain in a general liberal arts major, with only 6 percent completing a major in the subject after starting there. As a result, while general liberal arts majors accounted for 17 percent of entering students, this field represented just 2 percent of the cohort who completed degrees (suggesting that this category is now the functional equivalent of an undeclared major in the past). Education and the natural sciences were the only other fields with retention rates below 70 percent among students starting in their fields (at 69 percent and 64 percent, respectively).
Figure 2: Noncompletion and Change of Major Among Bachelor’s Degree Seekers, from Matriculation (in Fall 2017) to Summer 2024, by Primary Major Declared at Matriculation

Source: Custom data runs from the National Student Clearinghouse for the Humanities Indicators.
Conversely, only two fields gained more students from other fields than they lost to dropouts or changes in major. Approximately 20,000 more students finished with degrees in both the behavioral and social sciences and the humanities than had matriculated into those fields in 2017. In the behavioral and social sciences, for instance, of the 175,650 students who started their studies in the field, 49,775 did not complete a degree, and 29,895 switched to another field before finishing their degree. As a result, only 95,980 students from the original cohort started and completed a degree in the same field. However, 103,159 students switched into the behavioral and social sciences from other areas, making up the majority of the nearly 200,000 graduates in the cohort who earned a degree in this field. Consequently, 52 percent of the students who earned a degree in the behavioral and social sciences had entered college planning to major in another field.
One in five students who started in general liberal studies had switched to the behavioral and social sciences by graduation, as did 9 percent of students who began in the natural sciences and 7 percent of students who started in the humanities. (The humanities saw a similar influx of students from other fields. For more details, see the Research Brief at the HI website.1)
Compared to the humanities and behavioral and social sciences, the natural sciences have both a lower retention rate among students starting in the field and relatively little in-migration from other fields. In fall 2017, the natural sciences started with 233,413 students, lost almost 125,000 students to attrition or other fields, and gained only 33,306 students from other fields. This resulted in a net loss of more than 91,000 students from the natural sciences.
Figure 3: Primary Field of Major Declared at Matriculation, by Primary Field of Degree (Fall 2017 Cohort, Status as of Summer 2024)
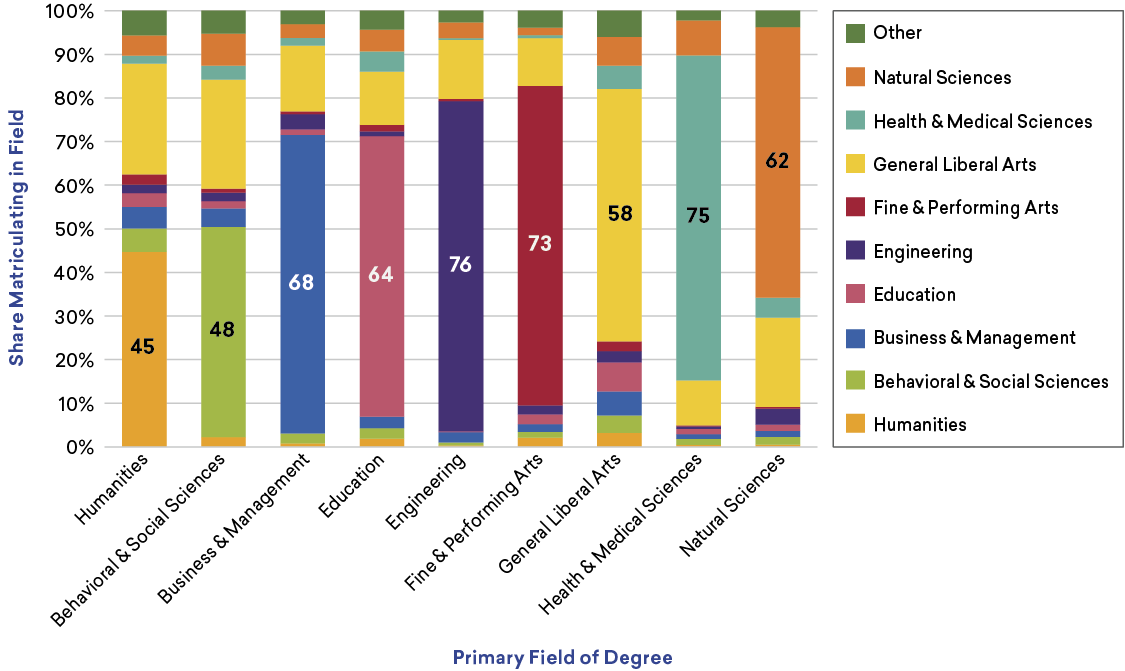
Source: Custom data runs from the National Student Clearinghouse for the Humanities Indicators.
Figure 3 shows the movement between fields from the perspective of the students in the fall 2017 cohort who completed a degree in each field. For example, only 45 percent of the students completing degrees in the humanities had started their studies with a major in one of the humanities disciplines, the smallest share of any field. In contrast, 76 percent of the students completing a degree in engineering and 75 percent of the students completing degrees in the health and medical sciences had started in those fields. This study was not designed to explore the reasons for these differences, but rather to highlight the variability in patterns of movement between fields.
What Is the Relationship Between First and Second Majors?
This study also examined the relationship between first and second majors. As shown in Figure 4, only a small percentage of college graduates completed a second major. Among students who started their bachelor’s degree in fall 2017 and graduated by the 2023–2024 academic year, 9 percent finished with a second major.
Students earning degrees in the humanities were more likely to complete a second major than their peers, with 16 percent of humanities graduates finishing a second major. This was more than three percentage points higher than the next closest field—the behavioral and social sciences (13 percent). In all other fields, 10 percent or less of the graduates finished with a second degree.
Figure 4: “Second” Major at Graduation, by Primary/“First” Major (Fall 2017 Cohort, Status as of Summer 2024)
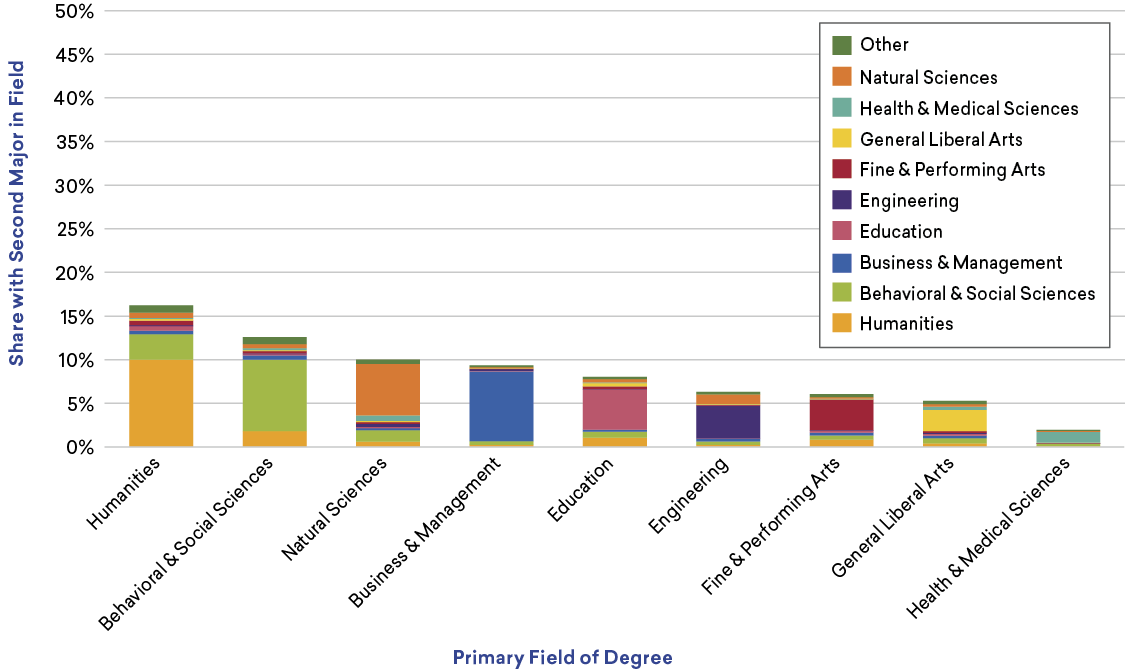
Source: Custom data runs from the National Student Clearinghouse for the Humanities Indicators.
Notably, in every field most students who finished a second major chose the same subject area for their first and second majors. About two-thirds of the students earning a second degree in one of the major academic fields received both degrees in the same field. Business and management majors stood out in this respect, with 85 percent earning their second degrees in the same field as the first, which was significantly higher than the next closest field, the behavioral and social sciences, at 65 percent. Numerically, the behavioral and social sciences awarded the most second degrees (25,046), followed by business and management (23,563). In all other fields except general liberal arts, the percentage of second degrees awarded was greater than 55 percent, with each field awarding fewer than 19,000 second degrees.
How Do Doctoral Completion Rates Compare?
As a final part of the research with the Clearinghouse, the Humanities Indicators looked at students who entered doctoral studies in fall 2015 to compare completion rates across fields. The study found completion rates above 50 percent for every field except general liberal arts (which was just below that threshold, at 49 percent). Among all students who began doctoral studies in fall 2015, 65 percent had completed a doctorate by fall 2024, while 35 percent had dropped out (or were no longer enrolled in a program), and 1 percent were still enrolled toward their degree.
Students who entered the natural sciences had the highest completion rates, with 78 percent completing their degree within nine years, followed by engineering and the fine and performing arts, each at 75 percent. Most other fields had completion rates between 62 percent and 66 percent, with one-third or more of their students no longer enrolled or working toward the degree.
These studies on baccalaureate and doctoral students are intended to enhance our understanding of how students move through their programs and how many complete their intended degree. While the studies were not designed to explain when or why students chose to end their studies or change the trajectory of their studies, the HI will continue to explore these issues in the coming months.
We welcome questions about these findings and suggestions for further areas of research. Please direct any inquires to Robert Townsend, codirector of the HI, at rtownsend@amacad.org.