The Case for Enlarging the House of Representatives
Part V: Impact of House Expansion on the Partisan Control of Congress and the Electoral College
How might adding members to the House affect the partisan balance of Congress? And, as expanding the House gives larger states more Electoral College votes, how could expansion change the partisan slant of presidential elections?
Given the current partisan balance of the states, we can simulate potential outcomes as the size of the House increases. In our modeling, we found very little partisan advantage to either Democrats or Republicans as the size of the House increases.
House Size and Partisan Balance
To estimate whether increasing the size of the House would change the likelihood of one party controlling it, we simulated ten thousand elections at each possible House size from 435 to 700 members, with the 2020 election results as a baseline.
For each simulation, we generated two random shocks (variances in the potential outcomes):
- Variation 1: A national shock in the two-party vote, with a standard deviation of 3 percentage points. This reflects the possibility that any election could be a “Democratic” or “Republican” year, and the national vote will shift a little in one direction or the other.
- Variation 2: A state-specific shock, with a standard deviation of 5 percentage points. This reflects the possibility that individual states might swing more strongly in one direction or the other, based on state-level factors including districting and individual candidates and races.
With the combination of shocks, we can estimate a baseline expectation for the share of Democratic votes in the state.46
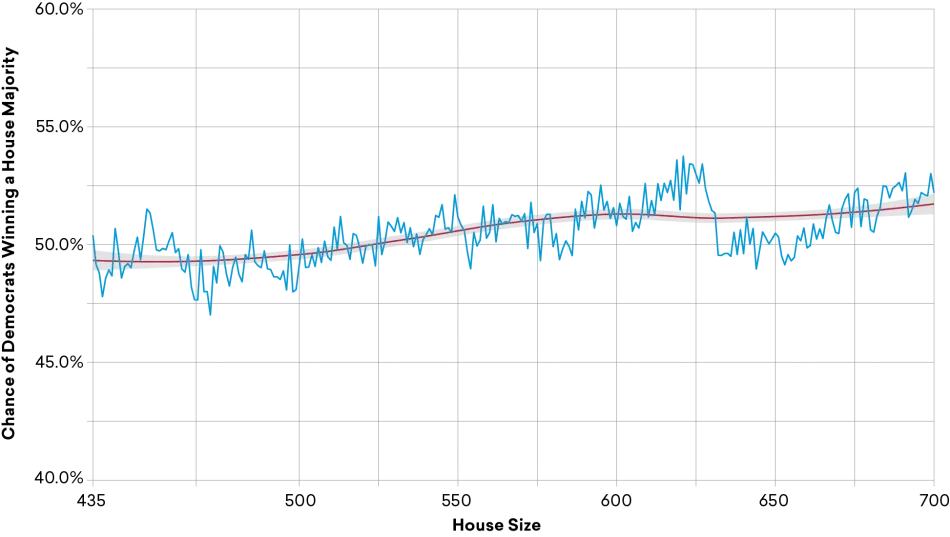
In Figure 3, the blue line indicates the projected partisan control of the House. When the blue line is above 50 percent at the House size noted in the x-axis, the model predicts that Democrats have a greater than 50 percent chance of controlling the House. When the blue line is below 50 percent, the model predicts Republican control. For example, the model predicts that, if the House had exactly 450 seats, Democrats would have a roughly 47.5 percent chance of controlling the House in the 2020 election, while at 700 seats they would have an almost 52.5 percent chance. The red line is a trend line, offering a picture of the overall average.
Figure 3
House Expansion and Partisan Balance
Increasing the size of the House has a tiny but variable effect on partisan balance
Source: Author calculations of projected district allocation based on 2020 census data using the Huntington-Hill method; simulations of balance of power based on actual 2020 House election results.
The model estimates a slight Democratic advantage from a growing House in the 2020 election. An expansion with no partisan impact would remain flat at 50 percent. In our model, though, certain House sizes increase the odds of Democratic control. Generally, if the 2020 election had been held with a House of more than 525 seats, the odds of Democratic control would have increased, though never by more than roughly 2.7 percent. The model does indicate quite a bit of random variation as House size increases. In fact, at many House sizes, especially between 436 and 524 seats, Republicans would benefit by 2 to 3 percentage points. These fluctuations derive from the fact that each incremental increase helps one party, and sometimes multiple sequential increases help one party repeatedly (hence the Republican advantage from a House with roughly 640 seats).
Effects on the Electoral College
A second uncertainty of increasing the size of the House is the extent to which it would impact the Electoral College. Each state receives one Electoral College vote for each House seat, plus two votes for each senator. Additionally, Washington, D.C., is granted three Electoral College votes, even though it is not a state. Since each state is guaranteed two Senate seats, the design of the Electoral College gives smaller states a slight boost in their relative voting power.
As noted in Our Common Purpose, recent demographic trends have shaped the dynamics of the Electoral College in a way that “cast[s] doubt on the legitimacy of presidential elections.”47 Specifically, recent trends have increased the likelihood that the winner of the popular vote will not win the presidency. This occurred just twice in the forty-four elections between 1824 and 1996. In the six elections since, it has also happened twice.
The gap between the largest and smallest states has grown tremendously since the nation’s founding, and the overrepresentation of small states in the Electoral College means residents of small states have much more voting power when it comes to picking the president. Increasing the size of the House would give bigger states even more Electoral College votes. While it would not wholly solve the overrepresentation of small states, enlarging the House would help reduce the College’s small-state bias.
But what would the partisan impact be?
As with partisan control of the chamber, we simulated ten thousand elections at each House size from 435 to 700, with seats allocated using the current Huntington-Hill method based on the 2020 election results.
For each simulation, we generated three random shocks:
- Variation 1: A national swing in the two-party vote share, with a standard deviation of 3 percentage points. This captures the extent to which issues and/or candidates might impact the potential outcomes.
- Variation 2: A state-specific swing in the two-party vote share, with a mean of zero and a standard deviation of 1 percentage point. This smaller-level state variation reflects the fact that in a nationalized election, like the presidential election, state-by-state performance is highly correlated and unlikely to vary much.
- Variation 3: A national swing in turnout, with a mean of 8 percentage points. We began with a baseline participation rate at 90 percent of the 2020 turnout, since 2020 turnout was exceptionally high. The reason for varying this turnout is because, when evaluating the impact on the Electoral College, we care about the relationship between the popular vote and the Electoral College vote.
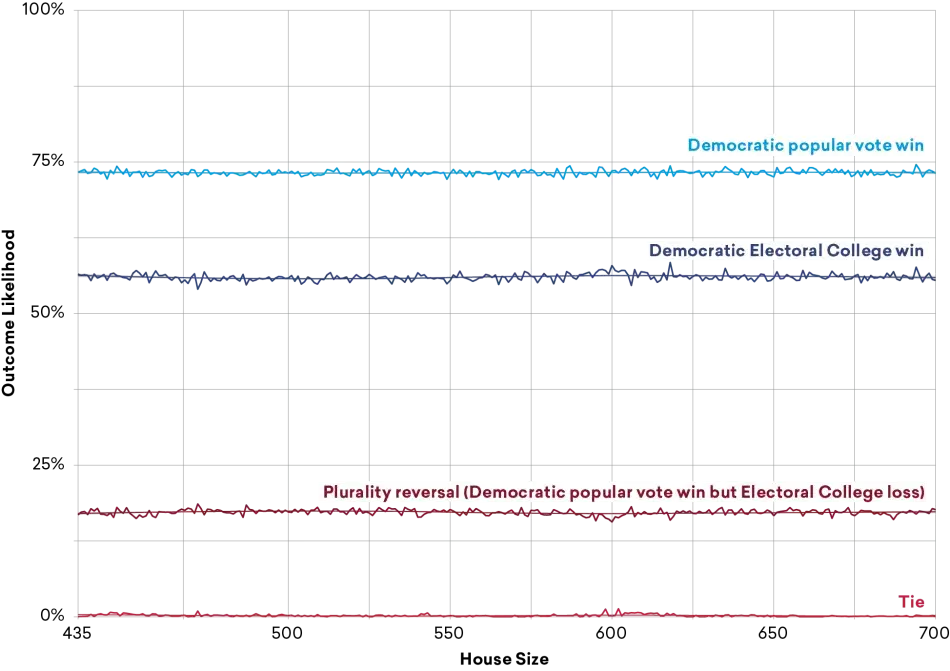
With these parameters, we can see that the partisan advantage is consistent even as the size of the House increases.
Figure 4
House Expansion and Partisan Impact on the Electoral College
Increasing the size of the House has no partisan impact on the Electoral College
Source: Author calculations of projected district allocation based on 2020 census data using the Huntington-Hill method; simulations of Electoral College results based on actual 2020 state election votes for president.
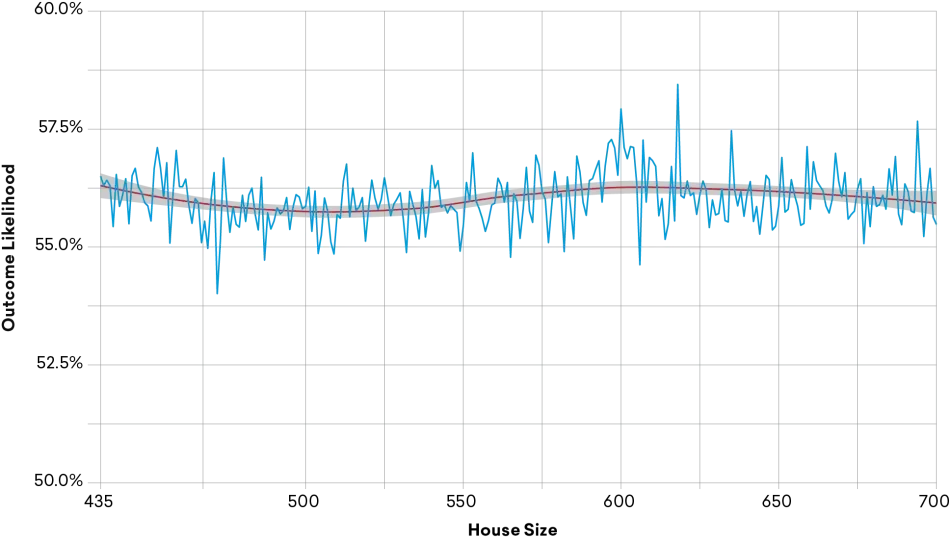
However, if we zoom in closer on the probability of a Democratic Electoral College win, we observe that there are very slight variations at different sizes of the House. But these do not appear to be much of a pattern. They look very much like random noise (Figure 5).
Figure 5
Impact of House Expansion on Likelihood of 2020 Democratic Electoral College Win
Increasing the size of the House has no partisan impact on the Electoral College
Source: Author calculations of projected district allocation based on 2020 census data using the Huntington-Hill method; simulations of Electoral College results based on actual 2020 state election votes for president.
Notably, this simulation predicts that Democrats win the popular vote about 73 percent of the time. Under the current House size, Democrats also win the Electoral College about 56 percent of the time. In all of these cases, Democrats also win the popular vote. In 17 percent of cases, Republicans win the Electoral College and lose the popular vote. In just 27 percent of the simulations did Republicans win both the popular vote and Electoral College. Under the current partisan alignments, there are no scenarios, even in ten thousand simulations, in which Democrats win the Electoral College but lose the popular vote. Scholars have long documented a partisan bias in the Electoral College, but that bias shifts from election to election as the partisan affinities of particular states change.48
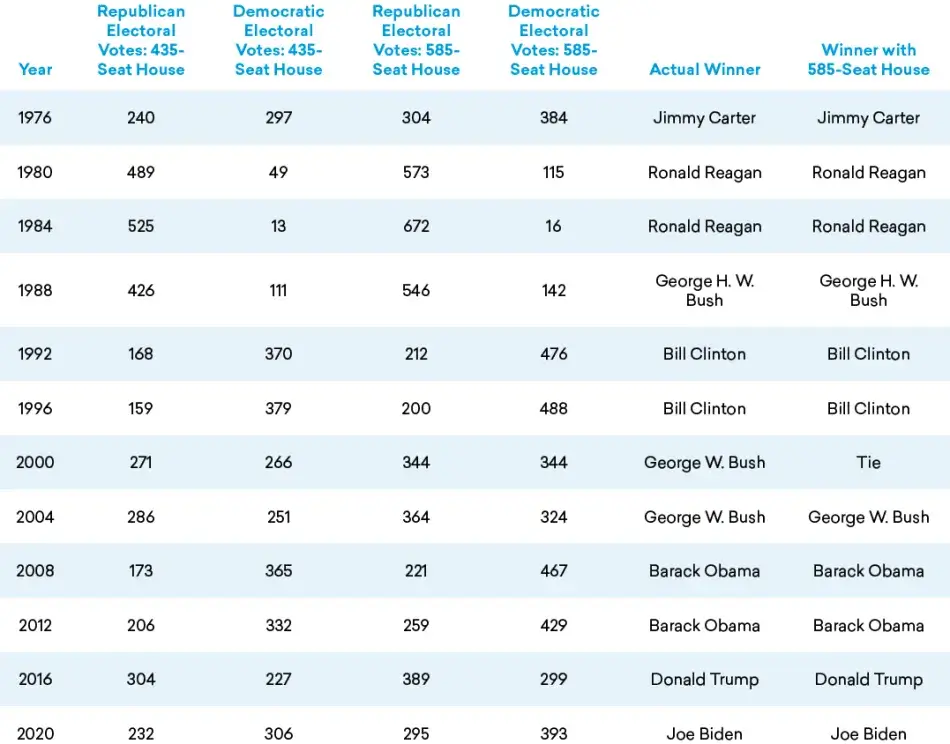
This modeling is based only on simulations of the 2020 election. To provide a deeper look at the effects of House expansion on the Electoral College, Table 4 shows the outcomes of each of the last twelve presidential elections with a House of 585 seats.
Other than the highly contentious 2000 election, increasing the House size to 585 would not have changed the outcome of any of the last twelve presidential elections.
Table 4
Presidential Election Outcomes with a 585-Seat House
Caveats
The predictions that emerge from the above simulations are based on the 2020 election. Since it is hard to predict future shifts in partisan balance, these results are time-bound. By allowing parameters to vary, these models are meant to incorporate a wide range of possible scenarios. Because we do not know which one is most likely, the average provides the best estimate. Generating ten thousand simulations at each House size produces many extreme scenarios. Absent a crystal ball, the strong conclusion at this juncture is that changing the size of the House would not generate a strong partisan shift in either control of the House or the outcome of the Electoral College. Certainly, different geographical configurations of partisan balance could have different effects. At this moment, however, no particular configuration is any more likely than any other.
