
By Robert B. Townsend, Director of the Humanities, Arts, and Culture Programs and Codirector of the Humanities Indicators
In recent months, the media has been filled with reports of colleges and universities nationwide cutting humanities programs, at institutions ranging from large state flagships (such as West Virginia University) to smaller liberal arts colleges (such as Simmons and Lasell Universities). To clarify some of the choices involved in these decisions, the Academy’s Humanities Indicators project is releasing a series of reports on the state of the humanities in each of the fifty states and the District of Columbia. These reports demonstrate the depth of the challenges facing the humanities (with the numbers of humanities degrees declining in all but three states), but they also provide resources to counter some of the prevailing narratives about career outcomes for graduates in the humanities.
The fifty-state perspective offers a distinct perspective on the challenges facing the field. At the national level, the number of bachelor’s degrees in the humanities being awarded fell 18 percent from 2012 (their recent peak) to 2021. Looking at that data in each of the fifty states underscores the scale of the problem, since humanities degrees have decreased by more than 25 percent in most of the states in New England, the upper Midwest, and the Pacific Northwest. Figure 1 shows the change in the share of bachelor’s degrees being awarded to humanities majors in each state from 2012 to 2021.
Figure 1: Percentage Change in the Share of Bachelor’s Degrees Awarded in the Humanities, 2012 to 2021
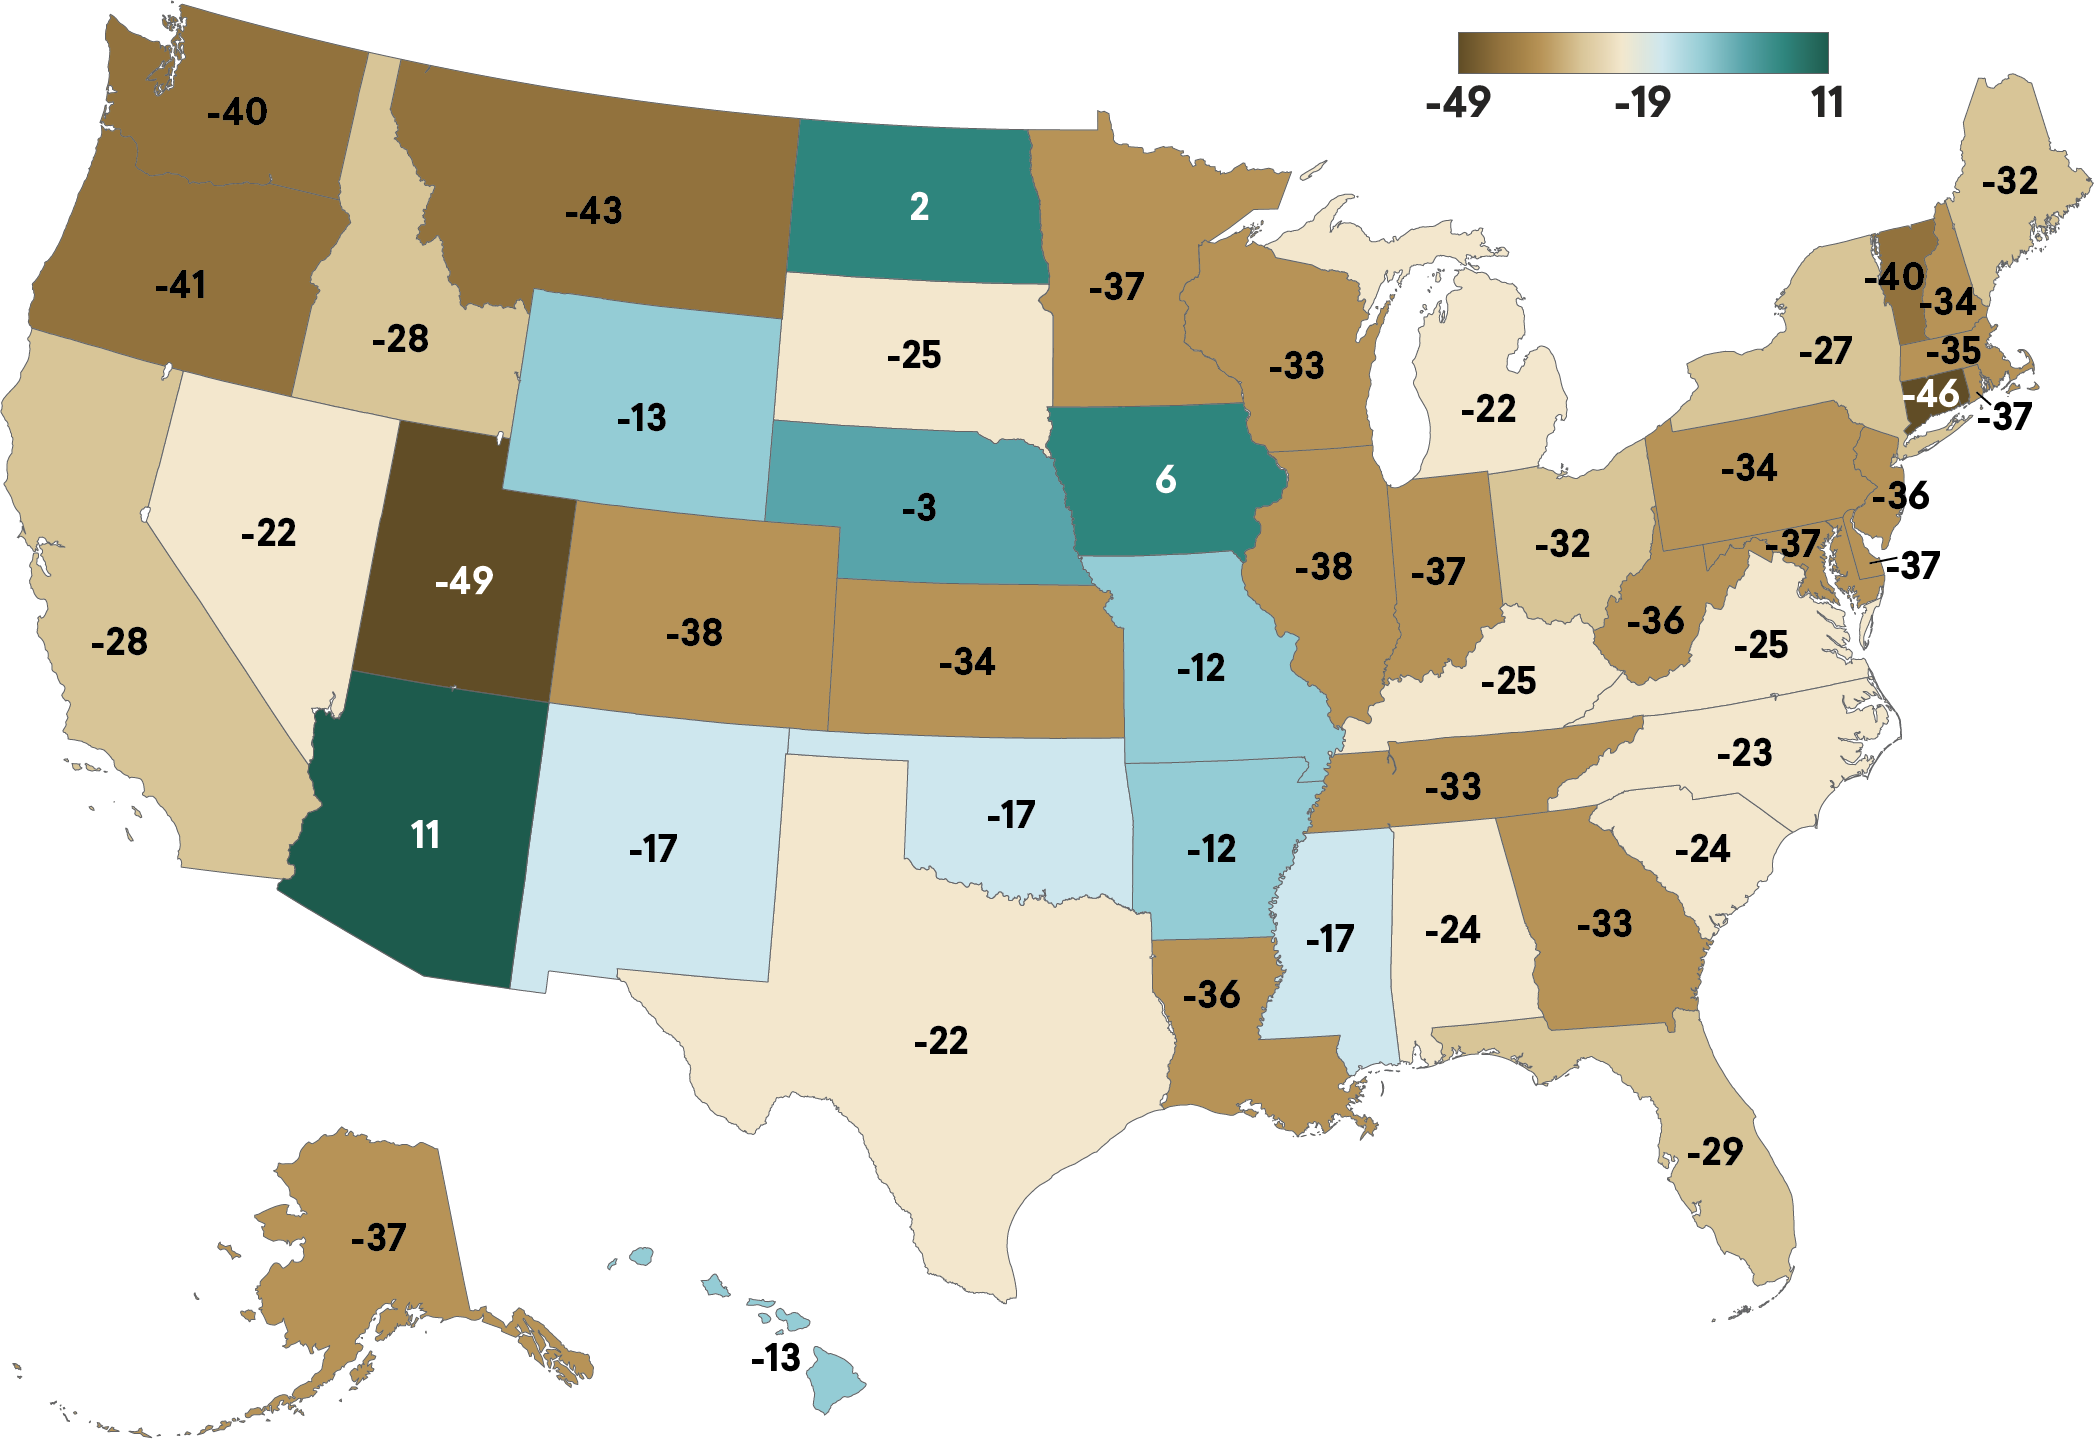
As Figure 1 demonstrates, the humanities field has gained “market share” in only three states (Arizona, Iowa, and North Dakota) over that decade. However, the gains in those states were for very different reasons. Colleges in Arizona have traditionally awarded a small share of bachelor’s degrees in the humanities (just 6.3 percent in 2012), so a modest increase in humanities degrees pushed the field higher in the mix of degrees being awarded in the state. In comparison, the number of students earning bachelor’s degrees in Iowa fell sharply, with humanities degrees falling a bit more slowly than the rest. Regardless of the particular challenges in each state, the recent trend underscores the fact that the humanities are facing difficulties in almost every state.
Since the recent declines are often attributed to student concerns about their job prospects, the Humanities Indicators is now publishing a series of reports looking at career outcomes for humanities graduates in every state. Drawing on data from the U.S. Census Bureau’s American Community Survey, the Indicators staff published a series of state profiles in October 2023 (available here) that estimate the number of humanities majors working full-time in each state, their median earnings relative to other college graduates and those without college degrees, how the humanities graduates are distributed across occupations, and their unemployment rate.
The results may provide useful answers for faculty members and administrators trying to address the concerns of students, parents, and state legislators. The findings show that in every state, the median earnings for humanities graduates are substantially higher than the median earnings for those in the workforce without a college degree. In all but four of the states (the Dakotas, Montana, and Wyoming), the median earnings for humanities majors were at least 40 percent higher than the median earnings of workers with only a high school degree.1 And in some of the largest states (California, Illinois, Maryland, New Jersey, New York, and Virginia), humanities majors have substantial earnings advantages (of more than 80 percent) relative to those without a college degree.
Of course, discussions about the “return on investment” for a college degree are often positioned relative to other college majors, rather than the much larger share of the population without a college degree. But even here, the median earnings for humanities majors are similar to or higher than their peers in the behavioral and social sciences, the arts, and education. In most states, the earnings for humanities majors are modestly lower than the median earnings of graduates from the natural sciences and business, with engineering majors the outliers relative to graduates from every other field.
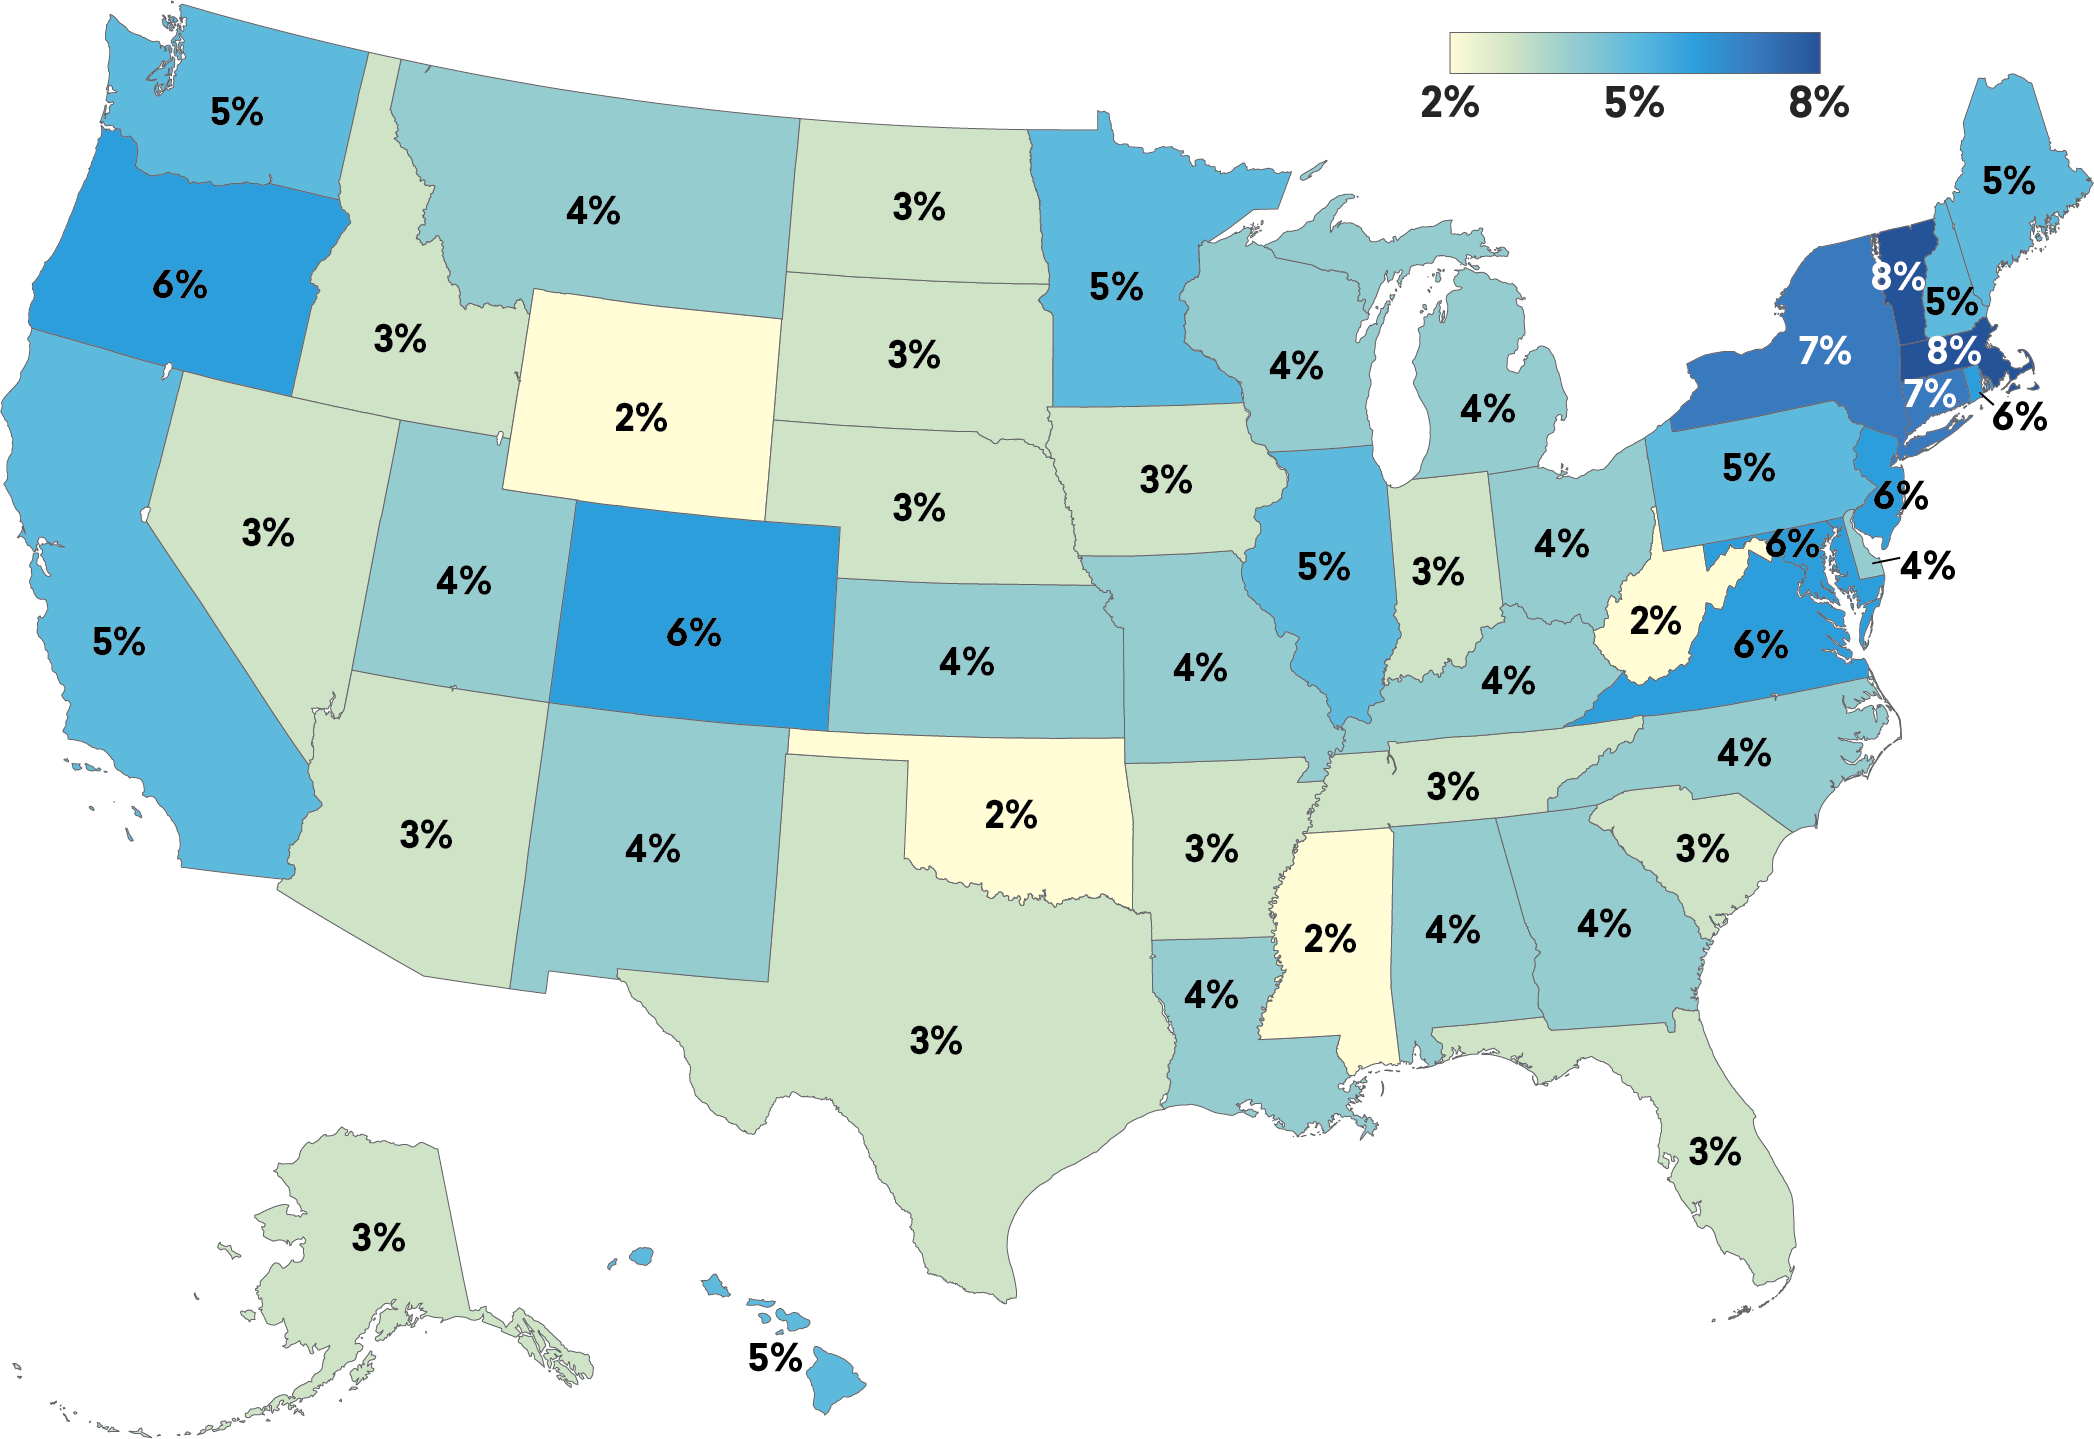
Figure 2: Humanities Bachelor’s Degree Recipients’ Share of the State Workforce, 2017 to 2021
The data also offer reassurance for concerns about whether a humanities degree will lead to the unemployment line. In the District of Columbia and in forty-three states for which it was possible to generate an estimate, the unemployment rate for humanities majors was similar to college graduates from other majors (typically around 3 percent), and lower than the rate for those without a college degree (with a state average of 6 percent).
The reports do, however, demonstrate more substantial differences among the states in the opportunities and types of work humanities graduates might perform. Humanities graduates have the greatest representation among full-time workers in Vermont (8.3 percent) and the least in Mississippi (1.9 percent). Some of that variation may be attributed to the differences among states in the share of the working population with a college degree (more than 44 percent of the full-time workforce in Vermont has a college degree, compared to just 29 percent in Mississippi). Even so, humanities graduates represent just 7 percent of the full-time workforce with a college degree in Mississippi, compared to 19 percent in Vermont.
And within those shares, there are substantial differences in the mix of occupations humanities graduates are performing. In thirty-one states, the largest share of employed humanities majors are in education jobs (though that share ranges from a low of 16 percent of the employed humanities graduates in Indiana to a high of 25 percent in Mississippi). In fourteen other states, the top job type for humanities majors was in service and sales. In the remaining five states (and the District of Columbia), humanities graduates were most likely to be in management positions.
The reports also highlight the occupations that rely heavily on the humanities to fill their ranks. In almost every state, the legal profession and the museum/library fields depend on workers with a humanities degree. Looking across all the states, an average of 28 percent of workers in the legal profession had a bachelor’s degree in the humanities (ranging from 15 percent in Mississippi to 37 percent in Oregon). Humanities graduates are even more overrepresented in museum and library occupations. An average of 35 percent of the museum/library workers in each state had majored in the humanities (with the percentage ranging from a low of 22 percent in New Mexico to over half of such workers in Vermont).
Taken as a whole, the new profiles offer a more localized picture of the career outcomes for students who have majored in the humanities, and provide a tool for those seeking more information. It is important also to note that earnings and occupations are not the only measure of success in one’s career or life. An earlier report from the Humanities Indicators (available here) offers measures of job and life satisfaction for humanities graduates (albeit only at the national level).
A forthcoming report this spring with additional state-level information will provide details (where possible from the available data) about earnings estimates by gender, race/ethnicity, and humanities discipline.
For more information about the Humanities Indicators, click here.
Endnotes
- 1Earnings and unemployment estimates are for workers aged 25–59.